It’s all in the interpretation
Written by John Francis, Director of Agrista on October 19, 2025
The pooled data from another year of Agrista benchmarking is back and it is one of those years where it is fair to be a little bit confused by some of the results. Agrista reports data for comparisons as an average of an aggregated data pool. The average of all data and the average of a cohort of producers ranked on profit. The comparisons aim to identify those features of the more profitable cohort to establish opportunities for improvements within a comparative business.
Comparative livestock performance data in the Agrista benchmarking report is presented as two cohorts based on the ranking of operating profit per dry sheep equivalent (DSE). The average is presented as the average of all data while the elite is presented as the average of those data sets which ranked above the 80th percentile for net profit per DSE.
The average is calculated by adding the output for each data point for each participant in the data set and dividing by the number of participants. Thus, if there were 100 data sets in the pool of data the average for each data point reported in the analysis would be calculated by adding all of the results and dividing by 100.
The elite is calculated by adding all of the results of those participants who ranked greater than the 80th percentile (top 20%) and dividing by 20 relating to the number of participants ranking above the 80th percentile. The performance of the elite therefore is the average of the top 20% which is typically, but not always, closer to the 90th percentile rank.
At the enterprise level, the benchmarking report includes a list of performance metrics based on an assessment of financial and productivity components. Sales, operating expenses and production per hectare are just three examples of performance metrics. Performance of the elite cohort is not an assessment of the highest 20% performance for each metric, rather the cohort is ranked based on operating profit per DSE and data for each metric is aggregated as an output.
Financial and production benchmarks are best derived from multi-year analysis, preferably from businesses with multiple years of performance, rather than a single year of data.
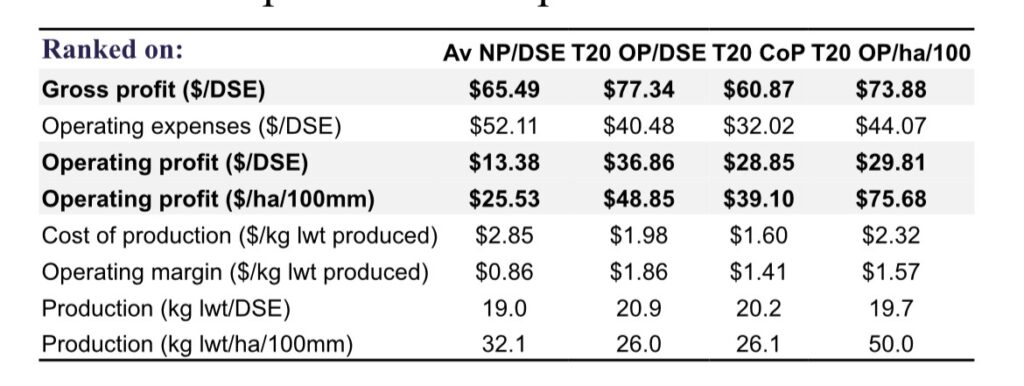
The beef data from the 24/25 benchmarking year demonstrates why a single year of data should not be used for deriving benchmarks. Table 1 shows an extract of performance measures for beef enterprises for the 24/25 year. The four columns from left to right represent data as outlined following:
Av NP/DSE – the average of all beef data
T20 OP/DSE – the average of beef data points who ranked above the 80th percentile for operating profit per DSE
T20 CoP – the average of the 20% of beef enterprises with the lowest cost of production
T20 OP/ha/100 – the average of beef data points who ranked above the 80th percentile for operating profit per hectare per 100 millimetres of year analysed rainfall.
The data shows that production per hectare per 100 millimetres of rainfall is lower for the best-performing beef herds ranked by net profit per DSE or lowest cost of production, compared with the overall average. At first glance, this lower production could be misinterpreted as an appropriate benchmark or target, given the higher profits per DSE.
This is a nuance of that year: higher production did not deliver a lower cost of production in the average cohort, primarily due to higher operating costs from supplementary feed. It is only when examining the cohort ranked by net profit per hectare per 100 millimetres rainfall that it becomes clear that achieving the highest profits per hectare requires high production per hectare relative to rainfall.
The pursuit of higher per-hectare production by those delivering the best operating profits per hectare per 100 millimetres of rainfall delivered lower profit (-19%) and production (-6%) per DSE when compared with those delivering highest profits per DSE. Profit and production per hectare adjusted for rainfall was however 55 and 93% higher respectively.
Interestingly this same cohort did not have the lowest cost of production or the highest margin per kilogram of liveweight produced. They sacrificed some per DSE performance and margin to deliver additional production. This occurs because, after the lowest hanging fruit has been harvested, the next production gains tend to be marginally more costly than existing production levels.
Table 1. The comparative ranking approach dictates the financial & production outputs
What this means to you
Interpretation of benchmarking results requires an understanding of the context of the information presented. Production benchmarks for enduring profitability are best not derived from single year comparative analysis.
John Francis is the Director of Agrista, an Australian agricultural consultancy based in Wagga Wagga, New South Wales. John leads initiatives focused on improving farm profitability through evidence-based analysis of financial and productivity data.